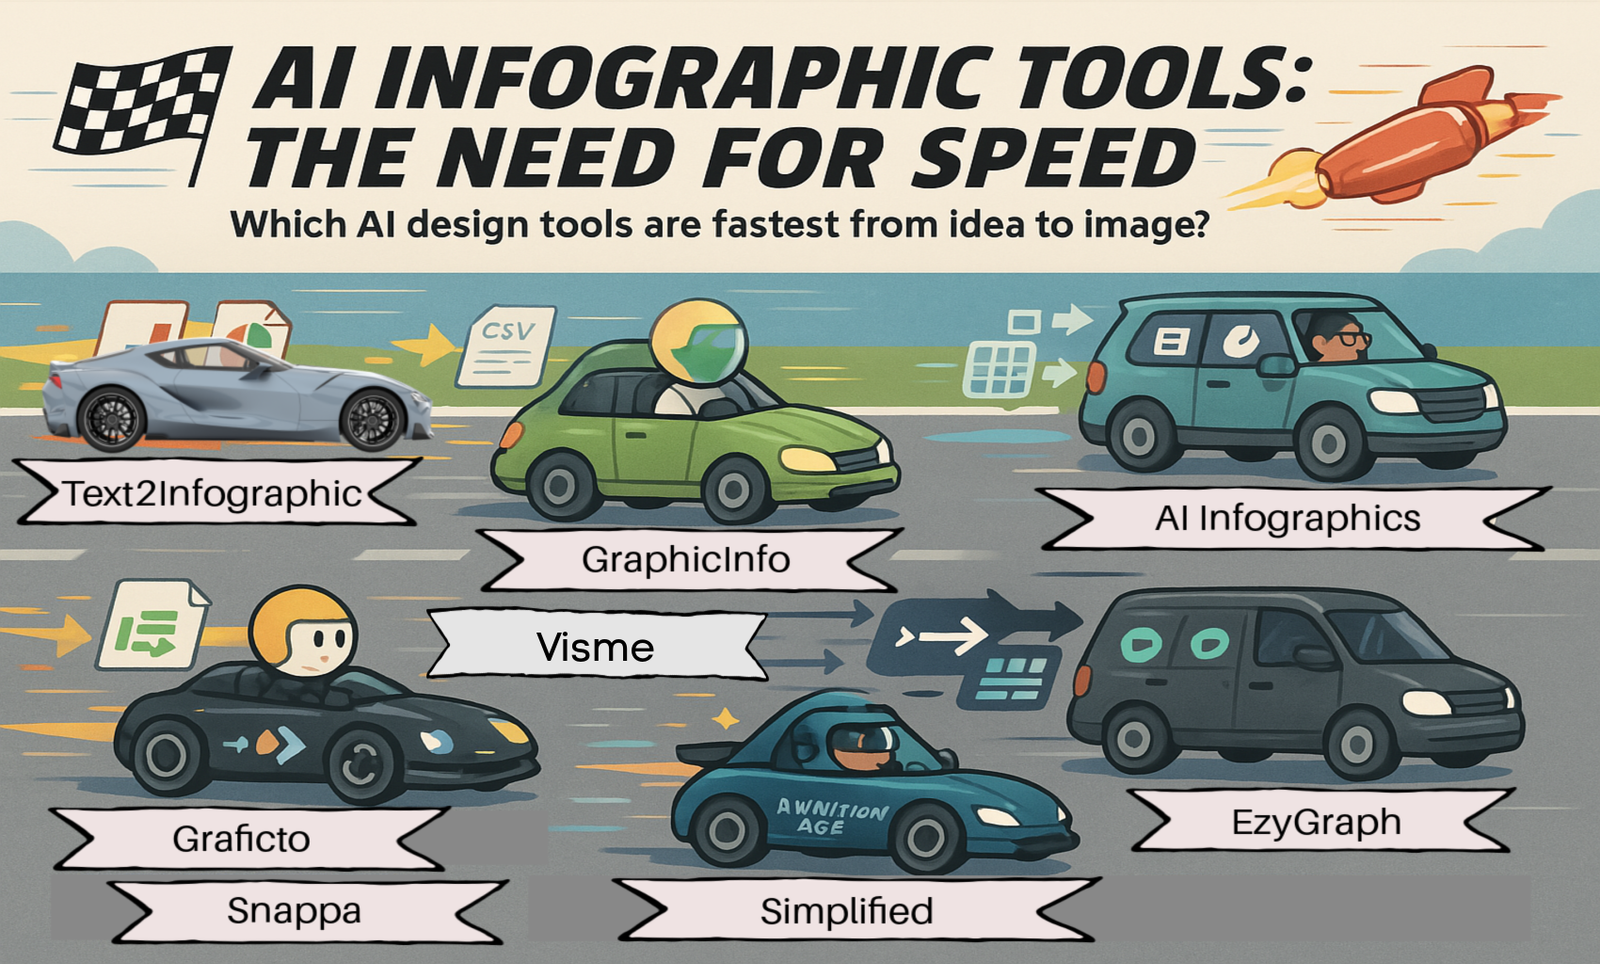
If you’re a marketer, blogger, educator, or content creator, you already know that visuals drive engagement. But creating clean, polished graphics takes time — and not everyone has a designer on speed dial. That’s where AI infographic tools can speed up your creativity and content creation.
These tools turn plain text, summaries, or simple prompts into compelling infographics, charts, and diagrams in seconds. No design skills, no templates, no stress.
Here are eight of the best instant AI infographics tools to help you go from ideas to images—fast.

1. Visme
Best for: Teams or solo creators needing branded infographics
Use case: Generate visual content with branded assets and AI
Key features:
-
- Text-to-infographic plus drag-and-drop editing
-
- Team collaboration tools
-
- Brand kit with fonts, logos, and color themes
-
- AI-powered content assistant and data visualization
-
- Interactive infographics with animation options
-
- Social media export formats (static & animated)
-
- Templates for reports, presentations, charts, and more
-
- Access to millions of icons, stock photos, and videos
-
- Analytics and viewer tracking
-
- Embeddable infographics and web content
Pricing: $14.99/$29.99/mo (all apps and full branding tools)
Rating:
-
- Speed: ★★★★☆
-
- Ease of Use: ★★★★☆
-
- Customization: ★★★★★
-
- Output Quality: ★★★★★

Best for: Quick data visuals and blog graphics
Use case: Turn natural language into bar charts, pie charts, or line graphs
Key features:
-
- Instant chart generation from plain English prompts
-
- No login or setup needed
-
- Clean design, export to PNG
-
- Especially fast for creating basic charts
-
- Minimal interface, no distractions
-
- Supports bar, pie, and line charts
Pricing: Free trial/$11.99/$23.99
Rating:
-
- Speed: ★★★★★
-
- Ease of Use: ★★★★★
-
- Customization: ★★☆☆☆
-
- Output Quality: ★★★★☆

Best for: Turning long-form content into infographic summaries
Use case: Paste a blog post or article to auto-generate a shareable visual
Key features:
-
- Summarizes and visualizes key points
-
- Clean, modern infographic output
-
- No sign-up, freemium
Pricing: $70 lifetime (Limited time offer)
Rating:
-
- Speed: ★★★★★
-
- Ease of Use: ★★★★★
-
- Customization: ★★☆☆☆
-
- Output Quality: ★★★★☆

Best for: Teams or solo creators needing branded infographics
Use case: Generate visual content with branded assets and AI
Key features:
-
- Text-to-infographic plus drag-and-drop editing
-
- Team collaboration tools
-
- Includes social media export formats
Pricing: $14.99/$29.99 (all apps)
Rating:
-
- Speed: ★★★★☆
-
- Ease of Use: ★★★★☆
-
- Customization: ★★★★★
-
- Output Quality: ★★★★★

5. Snappa
Best for: Social media and blog visuals
Use case: Use smart templates to build infographics and social posts
Key features:
-
- Drag-and-drop editor
-
- Templates designed for speed
-
- Built-in stock photo access
Pricing: Free/$10/$20
Rating:
-
- Speed: ★★★★☆
-
- Ease of Use: ★★★★☆
-
- Customization: ★★★★☆
-
- Output Quality: ★★★★☆

6. EzyGraph
Best for: Educators and professionals needing quick data charts
Use case: Convert spreadsheet-style data or typed descriptions into clean, downloadable graphs
Key features:
-
- Accepts CSV input or typed descriptions
-
- Generates pie, bar, line, radar, and doughnut charts
-
- Responsive previews and quick download to PNG
-
- No login required
-
- Supports dark mode
-
- Sleek UI ideal for classroom or report-ready visuals
Pricing: Free/$4.90/$8.90
Rating:
-
- Speed: ★★★★☆
-
- Ease of Use: ★★★★★
-
- Customization: ★★★☆☆
-
- Output Quality: ★★★★☆

7. AI Infographics
Best for: Visual storytelling from articles, blog posts, or summaries
Use case: Auto-generates stylish infographic layouts from text
Key features:
-
- Turns long-form content into modern, elegant infographics
-
- Variety of layout styles (timeline, list, compare)
-
- Built-in editor for tweaking visual content
-
- One-click export to shareable formats
-
- Free credits on sign-up
-
- Strong AI summarization capabilities
Pricing: Free/$7.50
Rating:
-
- Speed: ★★★★☆
-
- Ease of Use: ★★★★☆
-
- Customization: ★★★★☆
-
- Output Quality: ★★★★★

8. Graficto
Best for: Interactive and animated infographics
Use case: Create animated timelines, list infographics, and progress visuals
Key features:
-
- Dozens of very creative infographic templates (timeline, comparison, list)
-
- Dynamic visuals with animation and interactivity
-
- Browser-based drag-and-drop editor
-
- Supports export to PNG, PDF, and shareable links
-
- Great for educational and business presentations
-
- Custom icons and style themes
Pricing: Free/$5
Rating:
-
- Speed: ★★★★☆
-
- Ease of Use: ★★★★☆
-
- Customization: ★★★★★
-
- Output Quality: ★★★★★

Wrap-Up: Which Tool Is Right for You?
-
- Need lightning-fast charts from plain text? Try GraphicInfo or EzyGraph.
-
- Want visual storytelling from articles or summaries? Choose AI Infographics.
-
- Need branding and design flexibility? Try Simplified.
With these additional tools, your options for converting raw ideas into polished infographics just got even better — no design degree required. 🎨📊
Check out our AI design and AI image tool listings to find the top resources to kickstart your content engagement with visuals.
By Jeff Domansky, Managing Editor
Recent AI Marketer Tools Blog post:
OpenAI’s AI Audio Tool Breaks the Sound Barrier


